
Facebook after an election is probably at terrible idea. Yet curiosity not only deprived me of an hour of sleep on election night, it also kept me scrolling through endless angry and ecstatic articles.
I don’t have the time, energy, or ability to deal with hateful comments to deal with all of the logical fallicies presented on my News Feed tonight.
So I’ll just pick my favorite! It was sparked by this tweet:
This is how the future voted. This is what people 18-25 said in casting their votes. We must keep this flame alight and nurture this vision. pic.twitter.com/ivuXrar869
— Eliza Byard (@EByard) November 9, 2016
And reinforced this article: If You’re Feeling Sad Today Just Check Out the Millenial Electoral Vote Map.
If you were hoping to hear how I voted or what I think about the election, you can stop reading now. I’m more fascinated with the media ecological side effects.
At first glance, the facts line up with the map. There were, in fact, more people under 44 voting for Clinton than Trump and vice versa when we look at the over 45 crowd.
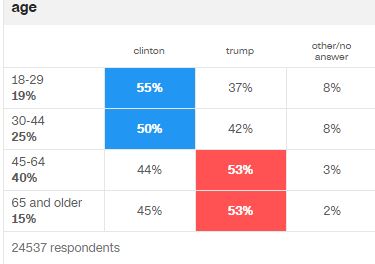
The color-coding makes that obviously appearant. But the percentages themselves aren’t that overwhelming–they all hover around 50%. Which means it’s a pretty even split in all age demographics on Clinton vs. Trump. I’m not statistiction but I’m guessing the percentage point differences aren’t statistically significant. If you are a statistiction, please comment and let me know!
Even if there was a statistically significant poll that showed the majority of folks under 40 voted for the Democratic nominee, I somewhat doubt that this signals an oncoming wave of liberal 50 year olds. At least, I surely hope that we all change and grow in the next 30 years–whether that means some of my peers switch parties, some dig their heels in deeper, or some become disallusioned and go live in hobbit hole somewhere.
Right now, it makes a lot of sense that younger people slant towards liberal policies. We advocate more for change when we’re young and we don’t know as much about the world. It’s easier to vote for higher taxes for richer brackets when we’re chilling by the poverty line. And we’ve only been a life for a quarter of a century so long-term effects don’t mean as much to us. It doesn’t mean we’re right, but it does make sense.
If a person is not a liberal when he is twenty, he has no heart; if he is not a conservative when he is forty, he has no head.’ — John Adams
This inherent media bias isn’t limited to young people. Throughout the news coverage I watched on NBC, an underlying assumption that all women voted for Clinton and all older males voted for Trump colored every question that asked.
One reporter asked, “As a woman, what was it like to vote for Trump?”
Last time I checked, women fill in little bubbles with regulation black ink the same way men do. I tested this and Luke and I have remarkably similar bubbling techniques. We credit the state mandated standardized tests of our youth. Thanks SATs!
While the color-shifting presidential race map was almost as fascinating as a lava lamp, I found the exit poll results to be telling an equally interesting story.
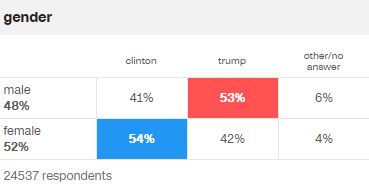
Perception: All women vote for Clinton
Reality
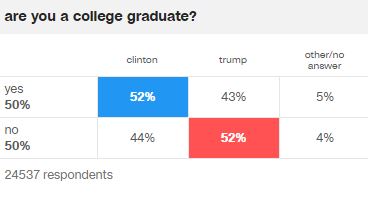
Perception: All college-educated folks vote for Clinton
Reality
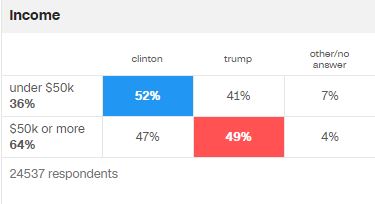
Perception: All rich people vote for Trump
Reality
Perception: All married folks vote for Trump
Reality
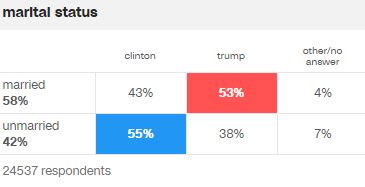
Just like the age demographics, our perceptions turned out to be true but just barely.
All that to say: young people can and will change and media outlets that try to support equality and free thought often squelch it with their inherent bias. Again, the medium is the message.
